Have you ever given a thought to how your life would be if google sheets could query your data in a SQL-like fashion?
Imagine a function that does all the data manipulation tasks and has commands of its own to communicate with the databases.
The google sheet QUERY function is the fantasy which I’m talking about.
It is a powerful function which takes SQL-like commands and allows you to manipulate the data in a simple and fast way.

First, make sure you get the example workbook used in this post to follow along.
What does the QUERY function do?
What it doesn’t it do!
Let me convey to you the potency and power of this function.
With its use, we can eliminate the need of conventional google sheet functions such as SUM, AVERAGE, FILTER, etc.
To impress you further, I would say sorting, filtering, limiting, and labeling the data is also possible once you know this function.
Finally, I would say you can merge the data from different sheets and join tables with the help of the google sheets QUERY function.
Check out these posts which contain examples of what the QUERY function can do.
- Lookup data with the QUERY function
- Sort data with the QUERY function
- Filter data with the QUERY function
- Add leading zeros with the QUERY function
- Group rows with the QUERY function
It’s so versatile, it could even be used for simple calculations like squaring a number or joining first and last names.
However, it is a bit hard to master this function, and you will need some practice plus an in-depth guide that walks you through the world of it.
The second part is with us, though. All you need to do is a bit of practice.
Syntax for the QUERY function
The syntax of the google sheets QUERY function is as shown below.
= QUERY ( data, query, [headers] )At first glance, it looks no different than any normal Google Sheet function. It has three arguments, out of which two are mandatory and one optional argument.
dataspecifies the range of cells on which you want to apply the function.queryspecifies the method or way to manipulate the data. The language used to develop clauses in this argument is Google Visualization API Query Language. The commands or clauses are similar to that of SQL queries, sometimes more straightforward than SQL.headersis an optional argument and comes into the picture of showing how many title rows your data has.
Now enough talking! Let’s get our hands dirty with some examples of the QUERY function.
Dataset

The supplies dataset is about 1000 rows and a week’s sales history. It is an imaginary database created solely for this article.
This dataset consists of seven columns.
- DATE – this column specifies the dates on which sales happen. It has date values from 23 May to 28 May 2020.
- Courier Partner – this column has the courier partner names. We have four unique values for this column: ABC Courier Services, DHL, Emirate Couriers, and FedEx.
- Shipping Country – specifies the country names to which the product is shipped.
- Product – this is a column with product names.
- Customer Name – customer to whom the product is shipped
- Quantity – specifies the number of items shipped
- Net Value – shows the actual sales amount.

Before I start the examples, I have created a new tab named Query Results inside my google sheet. For all of the sample queries, you will see the output in this tab.
The Data tab, on the other hand, will have the actual data.
How to Select the Entire Data with the QUERY Function
To select the entire data from a google sheet, you have the first introductory clause named SELECT.
The SELECT clause with a combination of an asterisk (*) gives you the entire data from your table.
It will be similar to the SQL SELECT statement. The only difference will be the absence of the FROM clause. You don’t need it while working with the QUERY function.

= QUERY ( Data!A1:G1000, "SELECT *" )Inside the Query Results sheet, navigate to cell A1 and put the above formula to get the whole table from the Data tab.
This is one of the amazing features of the QUERY function is it can return an array and not just a single value result. You can use this to automatically fill down your calculations instead of copying and pasting formulas down a row.
📝 Note: Make sure you put the SELECT * clause inside double quotes as it needs to be entered as a text string.
Explanation
- The QUERY function takes range A1:G1000 from the Data tab as the first argument (data is the first argument, remember?).
- Then, for the query part, we use the pseudo-SQL SELECT statement.
- The asterisk (*) stands for returning all columns. As mentioned above, every query argument should be inside the double quote.

💡 Tip: Even if you omit your code’s SELECT * argument, the system will still return the entire table. See the screenshot above, and you will have a better realization.
Select Specific Columns With the QUERY Function

You have seen how to select all of the columns inside the QUERY function. What if you want to retrieve only specific columns from the table? What if you only want to extract the Product (column D) and Quantity (column F) columns from the actual data? You can do it by mentioning the column alphabets inside the function after the SELECT clause.
= QUERY ( Data!A1:G1001, "SELECT D, F" )Go towards the cell H2 and put the above formula to return specific columns from the actual table.
Explanation
- Here, in cell H2, the QUERY function first takes A1:G1000 as a data argument from the Data tab.
- Then, inside the SELECT clause, you mention the column alphabets (Column D and F) that need to be extracted and separate them with a comma (,).
This code will slice your data and return only the columns Product & Quantity.
How to Filter Data with the QUERY Function
Consider a situation where you want to filter the data based on some conditions.
For example, you may want to extract information about a specific country like the United States. Or you may want to show the data for a particular date. You may want to show the sales value greater than $1000, etc.
For such situations, we may have the FILTER function built-in under the google sheets. But believe me, using the WHERE clause under the QUERY function is more versatile than using the FILTER function.
- You can restrict how many columns are in the view.
- You can also use the aggregation functions such as SUM, MAX, MIN, AVG, etc., in combination with the WHERE clause.
Several operators are helpful while specifying the condition inside the function.
- We can use the numeric comparison operators such as equals to (=), not equals to (<>), less than (<), greater than (>), less than or equals (<=), greater than or equals (>=).
- To compare strings, we have starts with, ends with, contains, etc., operators.
- We can also use is null, is not null to check if the cells are empty or not.
- Logical operators such as AND, OR are also helpful inside the WHERE clause.
Filtering Numeric Data

= QUERY ( Data!A1:G1001, "SELECT * WHERE F > 35" )To filter the data based on numeric columns, you can use the above formula.
Explanation
Inside the SELECT statement, the WHERE clause returns all the values for column F (Quantity) greater than 35. We sold only nine products with a quantity greater than 35.
💡 Tip: Try using the other numeric comparison operators to play with your data.
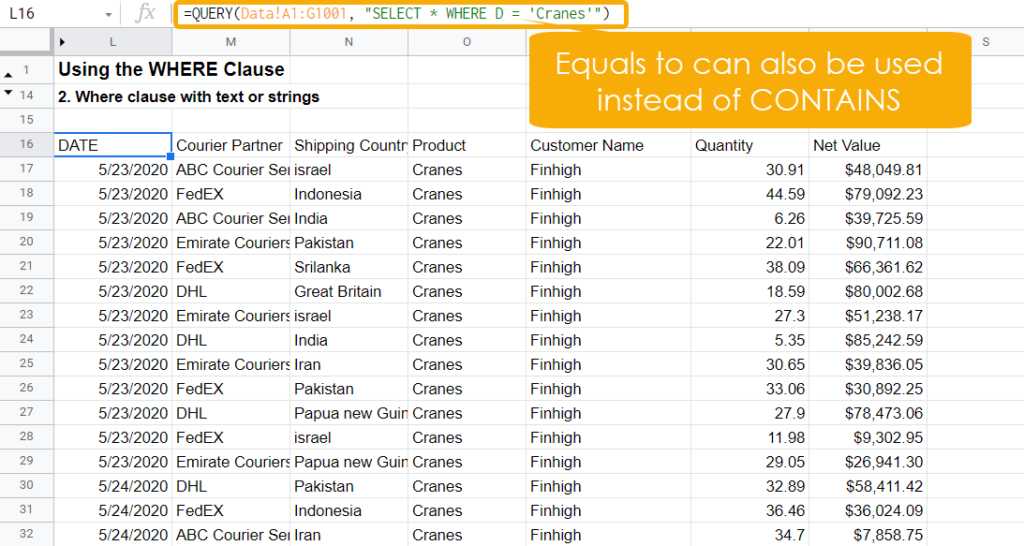
Filtering Text or String Data
Let us check how many cranes are sold during the week.

= QUERY ( Data!A1:G1001, "SELECT * WHERE D CONTAINS 'Cranes'" )To filter text values under the QUERY function, we can use one of the string operators. Let us use the CONTAINS operator to see how many cranes are present in our data. Formula is as given above.
Explanation
- The WHERE Clause uses CONTAINS method to see if the word Cranes is present inside column D (Product).
- Since we have used an asterisk, all columns for which Product value reads as Cranes will be shown in the output.
Exercise: Use all other string operators to see how they work under the QUERY function with the WHERE clause.
Note:
- While working on strings, don’t forget to enclose them inside single quotes. For example, Cranes is put under single quotes as a string in the above query.
- Instead of CONTAINS, you can use the equals to (=) operator to get all the Cranes data. See the above screenshot.
Filtering Dates
You can also filter the data based on the dates.

= QUERY ( Data!A1:G1001, "SELECT * WHERE A = DATE '2020-05-25'" )Consider a situation where you wanted to check all the sales data for the date 5/25/2020. You can achieve this using the WHERE clause inside the QUERY function. The formula is as shown above.
The thing with dates is, that they are stored as the serial numbers from the base date. Therefore, while working with them inside google sheets, you will always seek the help of functions such as DATE, YEAR, MONTH, DATEVALUE, etc.
When you are working with the function, things are pretty simple. Just use the keyword DATE and after that, mention your date inside single quotes with the format yyyy-mm-dd.
Explanation
The WHERE clause checks if the date value is 2020-05-25 line by line and filters out those values.
The SELECT * clause returns all those filtered values in a tabular form.
Note:
- The DATE clause is mandatory. Consider it a bridge between a standard date format (yyyy-mm-dd) for querying and the date format you used in your sheet. Without that keyword, the formula could never fetch appropriate dates.
- Please pay close attention to the date; it has been enclosed in single quotes. You can’t write dates the same as numbers. Dates are considered as a string.
Aggregate Data Using the QUERY Function
Any query writing experience is incomplete without the aggregation functions.
The data manipulation will not happen if you don’t know the aggregation functions. Inside the QUERY function also you can use the standard aggregation functions such as SUM, AVG, MIN, MAX, and COUNT.
Now I’ll show you how to use these aggregation functions inside the QUERY function under the google sheet.
Using SUM Inside the QUERY Function
A sum is the most common aggregation type you will use, and the QUERY function is one of the many ways to SUM in Google Sheets.
Let us first use the SUM function on a single column inside the QUERY function

Sum of the Quantity column
= QUERY ( Data!A1:G1000, "SELECT SUM(F)" )The image above shows the Sum of the Quantity column. The formula is as shown above.
Explanation
It is pretty straightforward. The SUM function takes the column alphabet as an argument and returns a single value as a sum.
Using SUM multiple times inside the QUERY function

= QUERY ( Data!A1:G1001, "SELECT SUM(F), SUM(G)" )The SUM function takes multiple column alphabets as arguments and generates a sum for each numeric column. The formula is as shown above.
Explanation
Inside the QUERY function, SUM is applied on column F and column G. This returns the sum of Quantity and Net Value columns.
Using SUM with the WHERE clause

= QUERY ( Data!A1:G1001, "SELECT SUM(G) WHERE A <= DATE '2020-05-25'" )The formula for the conditional sum is as shown above.
Explanation
The WHERE clause acts first. The dates 23, 24, and 25 are first filtered out, and then SUM is applied to column G to get the total Net Value for those dates only.
Using MIN and MAX
As the keywords themselves suggest, the MIN and MAX are aggregators used to produce the minimum and maximum values from the data, respectively. You can use these two aggregators on the Supplies database to generate minimum and maximum values.
Using MIN and MAX on a single column

= QUERY ( Data!A1:G1001, "SELECT MIN(F), MAX(F)" )The MIN and MAX functions take a single column alphabet as an argument and return the minimum and maximum values for that column, respectively. The formula is as above.
Explanation
Inside the QUERY function, MIN, and MAX take column F as an argument. Based on that, the system returns the minimum and maximum quantity values, respectively.
Using MIN and MAX on Multiple Columns

= QUERY ( Data!A1:G1001, "SELECT MIN(F), MIN(G), MAX(F), MAX(G)" )It is possible to use MIN and MAX on more than one column altogether. You have to call these functions more than once with the column alphabet as an argument. Write down the formula above to generate minimum and maximum values for Quantity and Net Value columns, respectively.
Explanation
= QUERY ( Data!A1:G1001, "SELECT MIN(F), MAX(F), MIN(G), MAX(G)" )The MIN and MAX are called on columns F and G, respectively. You can also change the execution order as it is not mandatory to call MIN first and MAX after that. The above formula is perfectly fine.
Using MIN and MAX with WHERE Clause

Consider a situation where we wanted to find out MIN and MAX values for Quantity and Net Value. But this time around, we wanted these values only for the country India.
= QUERY ( Data!A1:G1001, "SELECT MIN(F), MIN(G), MAX(F), MAX(G) WHERE C = 'India'" )The formula to achieve this result is as shown above.
Explanation
As we have seen in the previous example, MIN and MAX work on multiple columns together. This time around, we add a WHERE clause to filter all values with the Country = ‘India’.
The WHERE clause will execute first. Then the system will return minimum and maximum values for all lines where the Country is India.
Using AVG on a Single Column
The AVG function inside the query returns the average or mean value for a numeric column.

= QUERY ( Data!A1:G1001, "SELECT AVG(F)" )The AVG function takes a column alphabet as an argument and returns the average value for that column. Use the above code to achieve this result.
Explanation
Here, column F is provided as an argument inside the AVG function. The function returns the average Quantity sold.
Using AVG on More than One Columns
You can also use the AVG function on more than one numeric column. It is similar to using the SUM or MIN, MAX function on multiple columns.

=QUERY(Data!A1:G1001, “SELECT AVG(F), AVG(G)”)
= QUERY ( Data!A1:G1001, "SELECT AVG(F), AVG(G)" )To find the average Quantity and Net Value for the Supplies database, you can use the code above.
Explanation
The AVG function here takes the column alphabet as an argument. You have Quantity and Net Values stored in columns F & G, respectively; we provided those as an argument inside the function.
Using AVG With WHERE Clause
Suppose you want to generate the average value based on criteria. In that case, you can use the AVG function in combination with the WHERE clause.

= QUERY ( Data!A1:G1001, "SELECT AVG(F), AVG(G) WHERE D = 'Tyres'" )Consider a situation where you want to show the average Quantity and Net Value for a specific product. You can use the WHERE clause to restrict the product and then use AVG to generate average values.
Explanation
Here, the WHERE clause evaluates first to filter out all the ‘Tyres’ products. Then the AVG function generates the average of Quantity and Net Value. This example shows that almost four tyres were sold on average during that week, with an approximate average net value of $51,071.
Using COUNT inside the QUERY Function
The COUNT function inside the QUERY returns the count of rows inside the column on which it is called.
Similar to the other aggregation functions, this function also works on a single column, more than one column, and even with a WHERE clause.
The COUNT aggregator will only count non-blank values when used inside the QUERY function.

Consider a situation where we want to know the quantity count for dates less than or equal to a specific date. Achieving this is easy by using COUNT combined with the WHERE clause, as shown in the image above.
Explanation
The QUERY function first evaluates the WHERE condition and filters out the dates 23, 24, and 25 May 2020. Then, the COUNT function applies to column F to count the number of lines inside the Quantity column.
We can also use the COUNT function by itself.

Here, in this example, the COUNT function is applied to column F. It returns the count of non-empty cells inside that column.
💡 Tip: The COUNT function always returns the non-empty cells from the given data.
The LABEL Clause in QUERY Function
Now consider a situation where you want to change the column labels or assign labels to your data columns.
Can you do that inside the QUERY function? Absolutely, Yes!
The LABEL clause is specifically developed to deal with situations like this. It allows you to assign the labels to one or more columns.
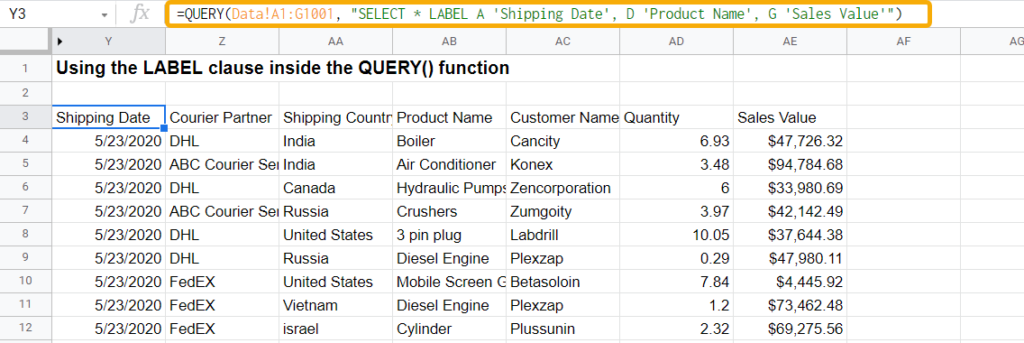
Consider you want to change the DATE, Product, and Net Value labels inside the dataset. The new ones should be Shipping Date, Product Name, and Sales Value.
= QUERY ( Data!A1:G1001, "SELECT * LABEL A 'Shipping Date', D 'Product Name', G 'Sales Value'" )The formula that does this task is as shown above.
Explanation
Inside the QUERY function, the LABEL clause takes column alphabets first. After that, enclosed are the new labels inside single quotes.
Each column header-label combination has to be separated using a comma (,).
📝 Note: The LABEL clause is free and independent. It doesn’t need the existence of other clauses for execution.
The LIMIT Clause in QUERY Function
What if I tell you that there is a way of restricting the appearance of the number of rows?
If I tell you that the QUERY function can pull only the first specific number of rows, will you be surprised?
The LIMIT clause is the answer to all of your requests. It restricts the number of rows inside the final view.
It comes after the SELECT, WHERE, and ORDER BY (we will learn this clause later) in terms of execution. However, you can use this clause as a standalone inside the QUERY function.

Consider a situation where you want to show Product, Customer Name, Quantity, and Net Value. Restrict the output with the condition that only customers with the letter “a” in their name should get selected. Finally, limit the view to show only the first ten rows.
= QUERY ( Data!A1:G1001, "SELECT D, E, F, G WHERE E CONTAINS 'a' Limit 10" )The equivalent formula is as shown above.
Explanation
The SELECT statement returns specific columns D, E, F, and G. The WHERE clause adds a condition that column E must contain the letter “a“.
Finally, the LIMIT clause restricts the output, and you can see only the first ten rows inside the final view.
SORT Data with the QUERY Function
Sorting is essential while manipulating large tables, isn’t it?
By sorting the data, you may get a glimpse of the highest or the lowest values.
Inside the QUERY function, You can use the ORDER BY clause to sort the data. It sorts the whole data by values from a particular column.
It appears after the SELECT and WHERE clause (If it is in the code). Having said that, it is independent and doesn’t need the user to execute a WHERE clause.
You can specify the sorting direction. ASC standard for ascending order, and DESC stands for the descending order. By default, the system will sort data in ascending order if the sort order is not specified.

You can create a situation where you select the Shipping Country, Quantity, and Net Value columns. The quantity should be more than 1 unit.
= QUERY ( Data!A1:G1001, "SELECT C, F, G WHERE F > 1 ORDER BY G LIMIT 10" )Sort the data in ascending order by the Net Value column and limit to return to only ten rows. The formula is as shown above.
Explanation
The SELECT clause restricts the column appearance. The WHERE clause only allows a quantity of more than 1 unit. The ORDER BY clause sorts the data based on the Net Value column in ascending order. Finally, the LIMIT clause restricts the output to ten rows.
If you want to sort the data in descending order, use the keyword DESC after the column name inside the ORDER BY clause.
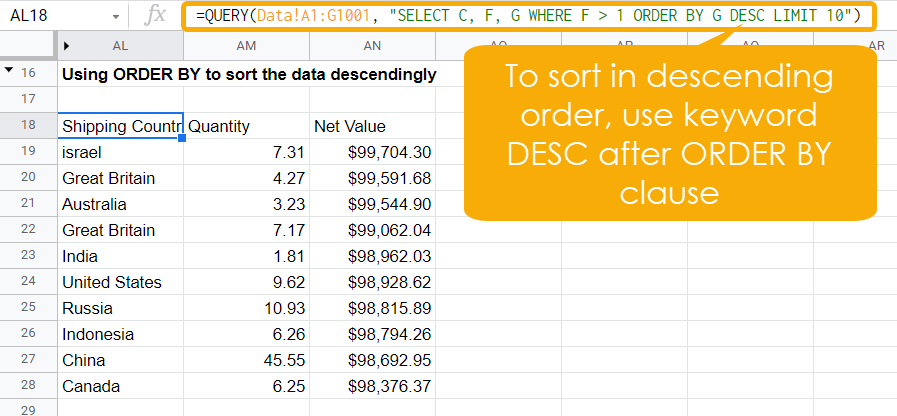
Consider the same example used above; however, we want to sort the data in descending order by Net Value column this time.
= QUERY ( Data!A1:G1001, "SELECT C, F, G WHERE F > 1 ORDER BY G DESC LIMIT 10" )Use the keyword DESC after the ORDER BY clause. The output is as shown in the image above based on the above formula.
Using GROUP BY with QUERY Function
Grouping data is a very useful way to summarize your data. There are many ways to group data in Google Sheets, including with the QUERY function.
The GROUP BY clause is very useful. It allows you to summarize your data in groups based on values from a specific column. You can consider it as something working on similar lines to the pivot table.

= QUERY ( Data!A1:G1001, "SELECT C, SUM(G) GROUP BY C" )Assume that you want to summarize the total sales for each country during the week in our Supplies data. You can achieve this by using the GROUP BY clause inside the QUERY. The output will be as shown in the image above. The formula is above.
Explanation
Inside the QUERY function, the GROUP BY clause groups the SUM of Net Value by country. Then the SELECT clause allows us to return the grouped output of Shipping Country and the sum of Net Value (we call it Total Sales).
Using logical Operators AND & OR inside the QUERY Function
The logical operators such as AND, OR are beneficial when you want to use two or more conditions together inside the QUERY function.
- You can use AND clause to combine two or more conditions. If the formula meets all requirements, the system will generate the output; otherwise, an error.
- You can use the OR clause when you want the function to evaluate if one of the conditions is true. If you have three conditions and at least one is true, the system should generate the output.
Using AND for Two Conditions

Consider a situation where you wanted the output in such a way that two conditions are being satisfied:
- The Shipping Date should be 05/25/2020 or above
- The Quantity should be more than 30 units.
= QUERY ( Data!A1:G1001, "SELECT C, D, E, G WHERE A >= DATE '2020-05-25' AND F > 30" )Since we need rows that follow these two conditions, we can club them using the AND operator, as shown in the screenshot above. The formula for this result is above.
Explanation
The WHERE Clause allows a condition to filter values from column A that are after 05/25/2020. The AND clause will enable us to add one more condition; the quantity should be more than 30 units. As both of these conditions are evaluating as TRUE, the system returns filtered rows as an output.
Using OR for Two Conditions
= QUERY ( Data!A1:G1001, "SELECT C, D, E, G WHERE C ENDS WITH 'e' OR G < 5000" )Here you have a situation where you need to have an output such that at least one of the following conditions should be fulfilled.
- The Shipping Country ends with the letter “e“.
- The Net Value is less than $5000.
Explanation
The explanation is pretty simple. We have two conditions added under the WHERE clause. If any of the conditions is true, the system will apply a filter to the data and returns the output. The OR clause here helps the system in decision-making.
Selecting Top N with the QUERY Function
The top N rows selection using the QUERY function is quite simple.
There is no clause designed explicitly for this. However, you can use the ORDER BY and LIMIT in combination with each other to return the top N rows from your dataset.

You want to select the top 10 rows based on sales history from the Supplies data.
= QUERY ( Data!A1:G1001, "SELECT C, D, E, G ORDER BY G DESC LIMIT 10" )The formula that returns the top 10 rows based on sales history is as shown above.
Explanation
The ORDER BY clause orders column G (Net Value) in descending order. The keyword DESC helps the system to sort in descending order. Then, the LIMIT clause restricts the number of rows to ten. Finally, the SELECT clause returns columns C, D, E, and G with ten rows in the layout.
Format Data with the QUERY function
The formats are equally crucial while working with your data.
For example, while working with financial data you might want your results to be displayed in accounting format.
Some data might not be in an appropriate form. Some might not be in the state you were expecting.
There are several ways of formatting data inside google sheets. Since this article is specifically on the QUERY function, we will only discuss compatible methods.
The scope of data formatting inside the QUERY function is limited. You can format the date, number, and time values only.
The FORMAT clause inside the QUERY function allows us to change the format of data.
Formatting Date Values
To format dates inside the google sheets, we have different ways. I am listing a few of the codes here that can help.
| Format | Description | Demo Example |
|---|---|---|
| yyyy or yyy | Full four digit year | 2020 |
| yy or y | Year in two digits | 20 |
| mmm | The month with three letters | Jun |
| mmmm | Entire month Name | June |
| mmmm | The first letter of the month | J |
| m | Month number without preceding zero | 6 |
| mm | Month number with preceding zero | 06 |
| d | Day number without preceding zero | 1 |
| dd | Day number with preceding zero | 01 |
| ddd | Day name with three letters | Mon |
| dddd | Full day name | Monday |
Let us see an example of formatting date values inside the google sheet QUERY function.
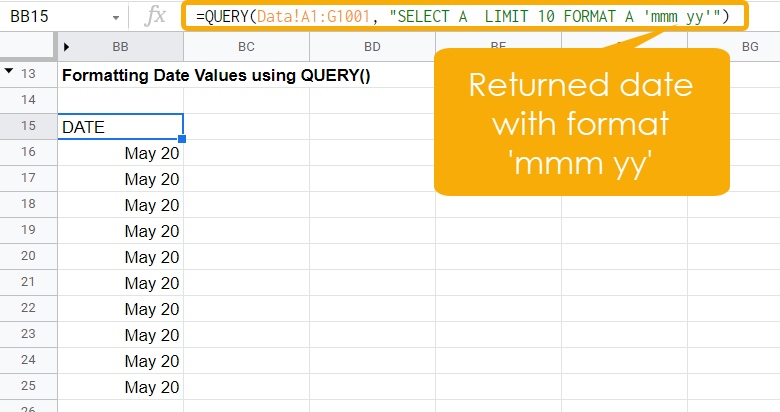
Here in this example, you convert and return the date values into mmm yy format. The LIMIT clause restricts the output to ten rows.
= QUERY ( Data!A1:G1001, "SELECT A LIMIT 10 FORMAT A 'mmm yy'" )The formula is as shown above.
You can use the combination of different date codes to generate a custom format of your own.

Here in this example, I have created a custom date format with the help of available date codes. You can create a date format of your own with the help of those.
= QUERY ( Data!A1:G1001, "SELECT A LIMIT 10 FORMAT A 'dd mmm, yyyy (ddd)'" )The formula for it is as shown above.
Formatting Numbers
To format numbers inside the google sheets, you have to follow the table given below:
| Number | Format Code | Format Value |
|---|---|---|
| 123456.123 | ####.# | 123456.1 |
| 23.16 | 000.0000 | 023.1600 |
| 25 | #.0# | 25.0 |
| 6.5 | #???/??? | 6 ½ |
| 15000 | #,### | 15,000 |
| 1543600000 | 0.00e+00 | 1.54e+09 |
Now you can format the number values inside the Supplies database.

Here, the format, #,#### is applied to the Net Value column. You can see the output as shown in the screenshot above.
= QUERY ( Data!A1:G1001, "SELECT F, G LIMIT 10 FORMAT G '#,####'" )The formula is as shown above.
If you want to apply format on more than one column, you can use a comma to separate the columns inside the FORMAT clause.

📝 Note: You can see the LIMIT clause was used to restrict output rows. The order of execution for the FORMAT clause is after the LIMIT clause.
Append Two Ranges with the QUERY Function
Once in a while, you will be coming up with a situation where you need to append two ranges from two different sheets.
Copying and pasting can be tedious. Moreover, if the data from other sheets changes, you will still need to do the copy-pasting.
Is there any other way of getting this task done?
Well, Yes! The google sheet QUERY function can help you in appending two ranges from two different sheets.

Suppose we have a range of 20 items for the date 05/29/2020 in another sheet, as shown above. You want to append this range to the original data.
Here’s how to achieve this using the QUERY function.

This example will merge the ranges from the “Data” sheet and those from the “Data 3” tab into the “Appended Ranges” tab.
The screenshot above shows how the two ranges are appended together.
= QUERY ( {Data!A1:G1001;'Data 3'!A1:G20}, "SELECT * WHERE Col1 IS NOT NULL" )The formula that does this is as shown above, and it looks interesting!
Explanation
- Inside the query function, ranges from the Data tab and the Data 3 tab are mentioned inside the curly braces. Use semicolon as a separator.
- The WHERE condition allows you to append non-blank rows only from both of the sheets.
- Finally, the SELECT clause returns all the appended rows together as a view. You have already seen a partial screenshot of it above.
You can append multiple ranges. Separate each with semicolons inside the curly braces.
Join Two Tables with the QUERY Function
Joining two tables is such an essential activity in day to day life of an analyst that you couldn’t live without it.
It allows you to join tables that contain related data based on a column that is part of both tables.
Unfortunately, there is no JOIN operator for the QUERY function yet, as there is in SQL. If you want to see all the ways you can lookup data, then check out our post on 7 ways to lookup data in Google Sheets.
Here’s how we can join two tables inside the QUERY function.
You have a situation here. The Supplies table we have been using appears incomplete as the Unit Cost is not a part of it. We have stored the Unit Cost based on Product inside a new tab named Data 2.

You want to join two tables together based on the Product column to use the Unit Cost for further calculations.

Joining two tables together using the QUERY function is a bit tricky because, unfortunately, there is not a JOIN clause available like in SQL.
You need to take the help of the ARRAYFORMULA and the VLOOKUP function to get this done inside the google sheet.
= QUERY ( {Data!A1:G1001, ARRAYFORMULA ( VLOOKUP ( Data!D1:D1001, 'Data 2'!$A$1:$B$1001, 2, 0 ) ) }, "SELECT *" )The formula to get this done along with the screenshot is as above.
Explanation
- We initiate the curly braces and use the first table range. Then we initiated the ARRAYFORMULA function. This function allows you to use an array inside the VLOOKUP function which is a non-array function.
- Then we used the VLOOKUP function to lookup values D1:D1001 from the table present inside the Data tab. We are looking those values into the table from Data 2 tab and fetching the second column (i.e., Unit Cost).
- Finally, we are using the SELECT clause to return the entire output.
Note:
- Usually, the VLOOKUP takes a single cell value as a lookup value. But in this case, we are using the entire array (D1:D1001) as a lookup value. To let this happen, we have enclosed VLOOKUP inside the ARRAYFORMULA.
- There should always be a column that is common between two tables.
You can use this formula to join different tables together and enhance your data manipulation skills.
Conclusions
The google sheets QUERY function is an enhanced way of manipulating data in a SQL-like manner.
The language used to write arguments inside the function is pseudo-SQL, named Google Visualization API Query Language.
The function can perform tasks similar to SQL in terms of grouping, ordering, aggregating, selecting data, etc.
There is always more to learn about it, and this is not the end. In the future, we will come up with articles that emphasize more advanced ways of using the QUERY function inside google sheets.


Hi Lalit, Thank you so much for publishing this article it was very easy to follow and quite informative. I was wondering in the section SORT Data with the QUERY Function, the example where it lists the top 10 countries and Great Britian appears twice, is it possible to only show the top Net Value for Great Britain. So meaning only one result will return for Great Britain, or any other country that appears more than once, and ignore the lesser values?
You could use a GROUP BY clause to aggregate the data by country first.