Google Sheets are currently a favorite in the spreadsheet market.
A lot of businesses use them to track, manipulate, and analyze data. They allow you to organize your data and do various operations and come with flexible sharing options.
If you are a frequent Google Sheets user, you might agree they provide various ways of getting a particular task done. There are usually at least 3 different approaches for any task after considering the QUERY function and Google Apps Scripts.
However, the most common of tasks while analyzing data is the need to sum numerical columns. You may need to show a total revenue, total cost for a product, a total number of items in your inventory, and the list go on.

In this post, I’m going to introduce you to 11 different ways of summing a column of numbers inside Google Sheets.
I bet you will find at least one new way that you didn’t know previously!
Sum a Column with the Status Bar
Some of you might have started thinking, What is a Status Bar? Where do you find it?
Trust me when I say you have used the Status Bar before. 😉
By default, the Status Bar appears at the bottom of your Google Sheet. If selected, it can show different summary statistics such as Count of Rows, Average, Sum, etc. You can see it activated as soon as you select a range in your sheet.

Suppose you have a small dataset with one column where all numerical values are stored, as shown above.

Select the data for which you want to show the sum through the Status Bar. In this case, the data range is A1:A6. Select it as shown in the screenshot above.
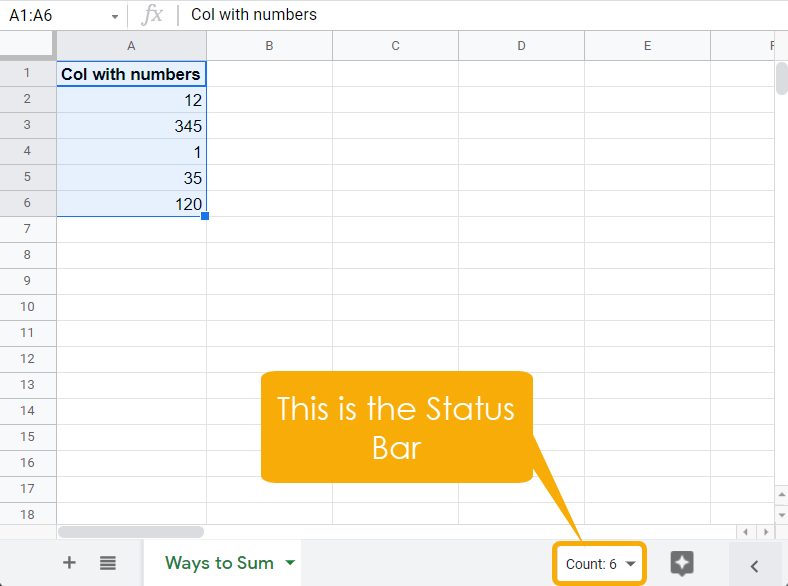
With the range selected, keep your eye on the extreme lower right corner. You will see a dropdown with either the Average, Count, or similar statistics.
For me, I can see the Count option by default as I set it manually some time ago!
Is it something you knew already? I bet you did!
To see the sum of the numbers, click on the dropdown and all the available summary options will be shown to you. Click the Sum option to show the total of these numbers.
This is how we can sum a column with numbers through the Status Bar.
📝 Note: You can select the entire column and still get the same result. Summary functions available under Status Bar only consider the cells with value.
Sum a Column with Column Stats
Another way in which you can get meaningful insights and specifically, the sum of numbers is by using the Column Stats.
Things like this small tool are something that makes me love Google Sheets.
This tool provides you with the summary statistics associated with a numeric column. You can get a quick idea about how many rows are empty, non-empty, Average values, Sums, Minimums, Maximum.
Moreover, it will also show you the distribution of your data.
To return a column sum through the Column Stats option, select the entire column of data.
This tool works in a way that once it is active, it stays active in the sidebar and returns the summary statistics for each column you select.

For now, select the range you want to have a column summary for.

- With the range selected, click on the Data tab from the menu. It will open up a variety of options associated with the selected data.
- Click on Column Stats to generate the summary statistics for the column.

As soon as you hit the option on the extreme right side of the sheet, you will see the Column stats window appearing, as shown in the screenshot above.

Scroll down a bit, and you can see the Sum of numbers inside the Column Stats window.
This is another great way of summing a column with numeric values.
Sum a Column with the Plus Operator
The third way of summing a column with numbers is the traditional way.
Remember in your school days, you were using the plus operator (+), right?
The same plus operator inside Google Sheets allows you to sum multiple cells from a numeric column.
The plus operator is an arithmetic operator that expects two or more inputs. Then the operator adds those numbers and returns the output.

To sum the column of numbers, navigate to any blank cell and insert the formula using the equals operator. In this example, I will insert the formula in cell A7.

After the equals to (=) sign, input the first cell you want to sum. In this case, my first cell reference will be A2. After A2, add the plus operator inside the formula.

Now, repeat this procedure for every other cell to A6. Make sure you add the plus operator between each cell reference.
After the last cell, there is no plus operator required.
=A2+A3+A4+A5+A6If you are lazy like me, copy the formula from above and paste it into any cell of your Google Sheets. 😄

You are almost done with the hard part. Now, hit the Enter key, and TaDa!
You can see the sum of cells A2:A6 inside cell A7, as shown above. I have added some formatting to make it look nice.
This is how you can sum a numeric column using the plus operator. If you have more cells with numbers in them, feel free to extend this formula further.
A couple of things to take note of here.
- I will not suggest this method to sum the numbers as it is time-consuming. It becomes relatively impossible to use when you have data with thousands of rows in it. You would not love to write a formula with thousands of cell references manually.
- If your numbers are store as text, it will convert them to numbers and return the total.
💡 Tip: The plus operator is one of the easiest ways to create a running total for your data in Google Sheets.
Sum a Column with the SUM Function
By far, the most used function in Google Sheets is the SUM function.
If you don’t want to end up being exhausted while summing up thousands of rows using the plus operator, adding this function to your list is a wise idea.
The SUM function inside Google Sheets takes numeric cells as an argument and then returns the total. You can either separate each value argument with a comma or select the entire range at once and add it as an input argument to the function.
Syntax for the SUM Function
SUM ( value1, [value2, …] )- value1 – is a mandatory argument that specifies the first value to add. It can either be a single value, single cell, or a range.
- value2 – is an optional argument, and can be a single value, single cell or a range of cells.

In cell A7 of your sheet, insert the formula by typing =SUM(.

Input the first value as A2 inside the function. You can manually type it or go and click select cell A2. After that, add a comma so that you can provide other values in the sum.

After the comma, add A3 as the second argument. Again separate with a comma and add subsequent arguments as well.

= SUM ( A2, A3, A4, A5, A6 )Finally, complete the formula by adding closing parentheses and hitting the Enter button. You will see the sum of the first six rows inside A7.

= SUM ( A2:A6 )There is a better way of selecting these rows that is less painful.
Inside the SUM Function, click on cell A2 and drag the mouse cursor down until row A6 to select the range A2:A6 in a single shot.
This method is less painful than choosing each cell individually and separating it with a comma every time.
📝 Note: The SUM function might return unexpected results if you’re using hidden rows or columns in your Google Sheets as the SUM function will include these hidden values.
How to SUM a Column with the Function Toolbar
Another way of summing up a column of numbers is by using the Function Toolbar.
The Function Toolbar inside Google Sheets holds a variety of functions from different Function Libraries.
These libraries organize the functions by task type. For example, the Filter library holds all the functions that are useful for filtering your data. You’ll find all these libraries inside the Function Toolbar in Google Sheets.
We can use the Function Toolbar to insert the SUM function and return the total of your numeric column.
It is by far the easiest way of adding the SUM function inside your cells. Follow the steps below to generate a sum using the Function Toolbar.

As a first thing, select the cell where you want the sum to appear. I am choosing cell A7, where I would like to have a total of A2:A6.

Click on the Σ (Sigma icon, the Greek letter) dropdown to access the Functions menu with the cell selected.

Once you click on the dropdown, you will see the entire Functions Library. It has various function categories, and each of those has several functions that you can access.

You have two ways of accessing the SUM function.
- You can either see it and select in the upper side of the dropdown, where it shows the frequently used functions.
- Or you can navigate towards the Math library and from there you can select the SUM function.
Both these ways are valid, and you can see those through the screenshot above.

You can see that the SUM function is now active in cell A7.

= SUM ( A2:A6 )Now, all you have to do is select a range on which you want to see the total.
For this example, we will click and drag to select the range A2:A7. Once done with the range selection, hit the Enter button to execute the formula.
Sum a Column with the SUBTOTAL Function
The functions you have used so far are really very useful with any numeric column. However, they have limitations. You cannot use the SUM function if you want a total of filtered data. For such cases, it will fail.
To deal with data where filters are applied, and you want to return the total of only the visible rows, then you need the SUBTOTAL function.
The SUBTOTAL function can be made to ignore any manually hidden rows or filtered rows from your dataset.
Analysts ideally use the SUBTOTAL function for three scenarios.
- They want to do different operations on the data, such as SUM, AVERAGE, COUNT, etc.
- They want to calculate different summary statistics for the filtered rows.
- They want to create dynamic summary statistics inside their report.
The scope of this function is really very vast and can’t be solely explained through this article.
Here, you should just concentrate on the idea of making a sum using this function and then making a sum for the filtered data as well.
Syntax for the SUBTOTAL Function
SUBTOTAL ( code, range1, [range2, …] )- code – A unique numeric code between 1 and 11 specifies the aggregation type used inside SUBTOTAL. It is a required argument.
- range1 – A first numeric range on which you want to perform the SUBTOTAL. Mandatory argument.
However, you can always include more than one range as an argument to work on this function.
| Aggregation Type | Code | Code for Ignoring Hidden Rows |
|---|---|---|
| AVERAGE | 1 | 101 |
| COUNT | 2 | 102 |
| COUNTA | 3 | 103 |
| MAX | 4 | 104 |
| MIN | 5 | 105 |
| PRODUCT | 6 | 106 |
| STDEV | 7 | 107 |
| STDEVP | 8 | 108 |
| SUM | 9 | 109 |
| VAR | 10 | 110 |
| VARP | 11 | 111 |
The list of codes for each function is as shown below.
Using the SUBTOTAL Function to Generate Sum for the Filtered Data

Suppose you have data, as shown above. You want to show the Total Net Value for the table. Note that this is a partial screenshot of the table.

At the bottom of the table inside cell C26, insert the SUBTOTAL function.

Since you wanted to aggregate the data using a sum, input the code argument as 9. Then, add range C2:C25 as the range1 argument.

= SUBTOTAL ( 9, C1:C25 )Finally, use the closing parentheses to complete the formula and hit the Enter button to execute it.

The beauty of this function lies within its adaptiveness. If you apply a filter on the above range and then unselect a few rows, the SUBTOTAL function will only return the sum for selected rows.
The SUBTOTAL function omits those unselected cells from the calculation and only returns the total for filtered cells.
This is something you can’t achieve with the SUM function. Even if you filter the rows out, the function will still return the total based on all the cells.
Therefore, if you want to show a dynamic total to the users based on a filtered view, the SUBTOTAL is advised over the SUM function.
Using the SUBTOTAL Function to Generate SUM for the Hidden Rows
Now, consider a situation where a few rows are hidden from your data. In such cases, the conventional approach with the SUBTOTAL function doesn’t work.

See above, for example. Here, rows 10 to 15 are hidden, and the SUBTOTAL function still generates the entire sum rather than giving us the total for visible rows.
The screenshot shows the conventional code argument doesn’t work with hidden rows as it does with filtered rows.
To tackle this issue, there are three-digit codes that can help you omit the hidden rows from the calculations.

= SUBTOTAL ( 109, C2:C25 )See above where I used code 109 instead of 9. The function ignores the hidden rows and generates a total for visible rows only.
The versatile SUBTOTAL function gives you two things.
- You can use it dynamically to show only the sum of filtered rows without altering the formula.
- You can also show the sum of visible cells when few cells are hidden out instead of filtered.
This function is much more powerful and flexible out of all the other ways discussed for generating sums.
Sum a Column Using the SUMPRODUCT Function
SUMPRODUCT is a powerful and versatile function from Google Sheets that allows you to do multiplication between each element of multiple arrays and then return the sum of that product.
This function is really unique as it can reduce the usage of two different functions for certain calculations (PRODUCT and SUM respectively).
However, this article is not about the various uses of SUMPRODUCT but different ways of returning the sum for a numeric column.
It turns out, you can use this function to generate only the sum for a given array.
Syntax for the SUMPRODUCT Function
SUMPRODUCT(array1, [array2, …])- array1 – is a mandatory argument and specifies the first array for which the function returns an elementwise product with any other arrays listed and then sums up the result.
- array2 – is an optional argument. An array to be multiplied and summed. The system will multiply each element of this array (if specified) with each component of the first array.
Now, if you eliminate the second array or subsequent arrays from the SUMPRODUCT function, it will work exactly like the SUM function to return the total of a numeric column.

Suppose you have the same data for previous examples. There are three columns Date, Courier Partner, and Net Value. This data specifies the total sales cost shipped through various couriers on specific dates.

Now, navigate down towards cell C26. Initiate the SUMPRODUCT function inside that cell.

Put C2:C25 as an array1 argument inside the function.

= SUMPRODUCT ( C2:C25 )Now, you will intentionally ignore adding any other arrays inside the function thereby generating a sum.
Complete this formula by adding closing Parentheses. Then, hit the Enter button to execute this function.
The explanation for this one is quite simple.
You have intentionally ignored the array2 argument. It means the system doesn’t have an array to make elementwise multiplication with array1. Therefore, the system just adds those components from array1 and returns the output.
Sum a Column with the SERIESSUM Function
The thing with Google Sheets is there are many ways of doing a task.
If used smartly, many functions can be used for alternative tasks.
The SERIESSUM function comes from the mathematical and trigonometric library in Google Sheets. The function helps generate a power series sum.
SERIES(x, n, m, a) = a1xn + a2x(n+m) + a3x(n+2m) + ... + aix(n+[i-1]m)The power series for which it generates the sum is as shown above.
Syntax for the SERIESSUM Function
SERIESSUM(x, n, m, a)- x – is a mandatory argument that specifies the power series input value. This can be any real value number.
- n – It is a mandatory argument that allows the system to identify by what power it should raise the x inside the power series.
- m – a step by which you want to increase the initial power (n). It gets added into initial power for each part of the series.
- a – an array or range of coefficients that will be in multiplication with the input value of power series.
All four arguments are mandatory inside this function.
Now, you will discover you can use the SERIESSUM function to generate the total for an array using specific inputs.

Navigate towards the cell where you want to make the sum. In this example, the cell where you put the formula will be A7.

Now, inside cell A7, initiate the SERIESSUM function so that you can use it to generate the sum.
Since the function generates a sum for a power series, you have to provide arguments precisely here.

- The initial value (x) should be 1 so that it will not make a power series.
- The first power (n) should also be 1 so that elements of the series are not raised to a power.
- The secondary power should be zero. Even if you put something else for this value, there would be no effect as the initial value is 1.
- Finally, inside the array of coefficients, you should add the range A2:A6 for which you want the sum to be done.

= SERIESSUM ( 1, 1, 0, A2:A6 )Finally, complete the formula by adding closing parentheses. Then, hit the Enter button to execute this function. You will see the sum of A2:A6 populated inside A7.
The result is a simple sum of the coefficients of the power series. In this case, a sum of the values in A2:A6.
Sum a Column with the DSUM Function
There is a database function named DSUM in Google Sheets which can be used to sum a column.
The DSUM function calculates the sum of a column with numbers based on a particular condition from a database-like array.
It works on similar lines to the traditional SUMIF function with some modifications.
With DSUM, you specify the entire dataset range, then set the field that needs to be summed, and finally, establish criteria based on which the sum happens.
Syntax for the DSUM Function
DSUM ( database, field, criteria )- database – is a required argument that specifies an array or range structure resembling the SQL databases.
- field – a required argument that allows the system to decide on which column the aggregation should happen.
- criteria – a required argument which specifies an array or range with zero or more criteria mentioned based on which the conditional sum can be returned.
Now, the question is can you make this function return the entire sum of a column?
The answer is simple; instead of providing specific criteria, give it an entire range to work on.

Assume you want to have the Total Net Value based on the Courier Partner as a criterion. Therefore, instead of using a specific cell as a criterion, use the entire column, and you will get the total.

Navigate towards cell C26. It is where you want to do the calculations. Insert the DSUM function inside that cell.

Now, provide the entire range from A1 to C25 as an input for the first argument (the database).

Since you wanted the sum of Net Value for the second argument, provide cell C1 as a value for it.

= DSUM ( A1:C25, C1, B1:B25 )Finally, for the criteria argument, provide an entire column range B1:B25 as an argument. This is because you want the Total Net Value.
If you would like to have a total for DHL only, select a cell that contains the text and use it as a criteria argument.

Add closing parentheses and hit Enter button to complete this formula. You will see the Total Net Value.
This is how we can sum a column of numbers using the DSUM function.
Sum a Column with the QUERY Function
It is almost impossible for someone to talk about Google Sheets without the QUERY function.
An advanced SQL-like code writing experience is enabled inside the Google Sheets using this function.
You can check out this post to learn all the details about the QUERY function.
There is a range of aggregation functions that you can use inside the QUERY function. You can use it to produce a COUNT, MIN, MAX, AVG, etc., to summarize your data.
We can use the SUM function inside the QUERY function to generate a total for a specific numeric column. In this case, the column will be the Net Value column.

Insert the QUERY function inside cell E2 from your sheet.

Provide the range A1:C25 as a data argument for the function. It is the data we want to apply aggregations on.

Now, for the query argument, use the SELECT SUM(C) argument inside the double quotes. Since you wanted the sum for Net Value in column C, you should mention the column reference using the SUM function inside the QUERY function.

= QUERY ( A1:C25, "SELECT SUM(C)" )Close the parentheses to complete the formula, and hit the Enter button to execute it. You will get the sum for the Net Value column.
Sum a Column with a Pivot Table
Pivot tables are an integral part of a data analyst’s life, and throughout different blogs, we have been pretty vocal about this.
Data summarization is certainly easier with the help of pivot tables.
The tool has various value summarization methods such as Count, Min, Max, and Average. It’s no surprise there is also a Sum option.

To add a pivot table inside Google Sheet, select the entire data across A1:C25.

- Go to the Data menu and click on it to access the various options inside.
- Select the Pivot table option to add a pivot table for selected range of data.
As soon as you click on the Pivot table option, the Create pivot table widow will appear.
Inside the Create pivot table window, you will see the data range A1:C25 automatically selected as a range for a pivot table.
Below that, two radio button options are associated explicitly for a location where the pivot table should be added.
Click on the Existing sheet radio button and select any cell from the current worksheet then hit the OK button.
Finally, click on the Create button to create a pivot.

Add the Net Value column inside the Values section of the pivot table through the Pivot table editor.

By default, the pivot table should use a SUM as an aggregator. But if you see a count, then this can easily be changed.

Now, under Summarize by section, click on the dropdown. You will see multiple aggregators associated with this column. Select the SUM option to return the Total Net Value.
Conclusion
There are various ways of summing up numeric columns.
The Toolbar, Plus Operator, Status Bar, SUM functions are the standard and well-known methods of generating a sum.
However, there are plenty of other non-standard options for summing that have been shown in this article. The SERIESSUM, DSUM, SUMPRODUCT are a few of those ways.
Hopefully, this post has helped expand your available toolset for the simple but invaluable sum. Let me know in the comments below if you can think of another method!


0 Comments