This post will show you all the methods you can use to count non-blank cells in Google Sheets.
Whenever you have a new dataset, it’s always a good idea to get basic descriptive statistics from the data to give you a summarized view.
One useful statistic is how many of your records contain a value. In other words, how many of the cells are non-blank or non-empty.
This will give you an overall sense of how complete your dataset is!

The good news is there are several easy ways to count the non-blank cells in any range in Google Sheets and this post will show you how it’s done. Get your copy of the example workbook to follow along!
Count Non-Blank Cells with Status Bar
This is a quick and easy step to use if you want to count the nonblank cells in your dataset.
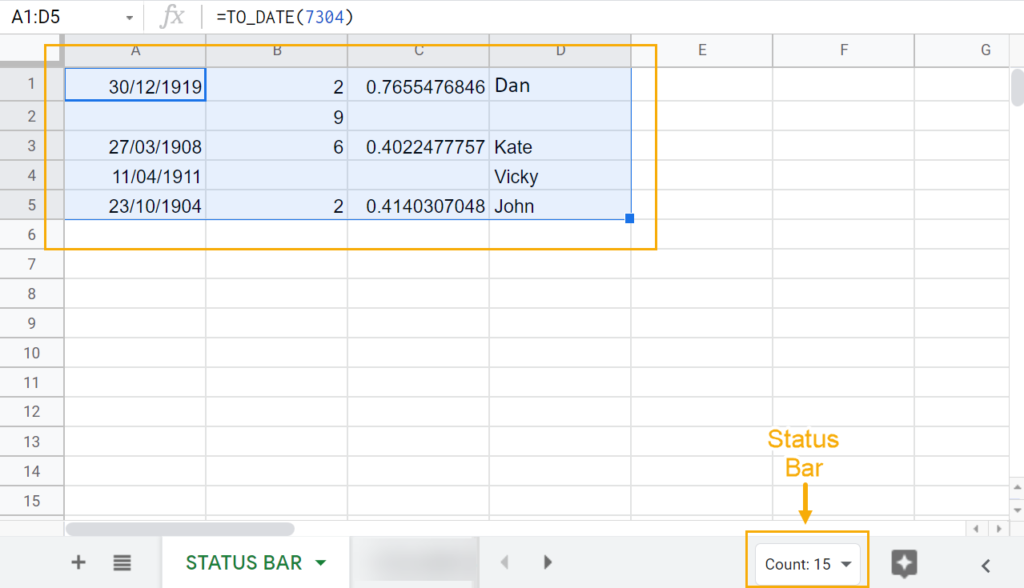
You will find the Status bar at the lower right corner of your spreadsheet when you select any range of values.
When you select a range, the status bar automatically calculates and displays a metric like the SUM based on the data format in the selection.
In this selection, the Status bar shows the Count of the dataset.
Count calculates the number of nonblank cells in the selection, which is 15 in this example.
The other metrics the Status bar provides are the Sum, Minimum, Maximum, Count numbers, and Average.
In case you don’t understand what Count numbers do, it calculates the number of cells that contain numbers in the selected range. It is very useful when a column contains data with text and numeric data formats.

To see how the displayed metric in the Status bar changes based on data type, select data from Column A.
Automatically, the Status bar will display the Min value in the column as indicated by the tick in front of the Min option.
The Status bar will display the Minimum value in the selected column because the values in the column are dates (shown in the formula bar). As such, the sum and average metrics are meaningless, but a minimum will represent the earliest date.
To reveal the other options, you can click on the dropdown arrow and select the metric you want to see. In this case, select the Count option to count nonempty cells.

When you select a range of numbers, you will get the full range of options in the Status bar.
You can do a column-by-column count of the number of nonblank cells in your data with the Status bar.
Count Non-Blank Cells with Column Stats
Column stats will give you everything you will get from the Status bar plus more.

It’s really easy to use Column stats.
Go to the Data menu and select the Column Stats option.

You can also use the right-click menu to access the column stats.
Right-click on the column label. If you want to see the column stats from Column A, you can right-click on A.

Column stats are divided into three sections.
In the first section, you get the Count and Distribution graph of the cell content. In this case, Count refers to the number of times an item appears in the column.
There’s also the option to Ignore rows, which is useful for excluding column headers from showing up in the stats.
The bar above the Ignore rows option shows the column header title, or the first item in your column if there are no column headers. You can use the arrows to move back and forth across columns.
In the second section, cell contents are sorted based on their frequency of occurrence. The Most and Least option determines the sort order.
The last section provides information about the count of Total rows, Empty cells, and Unique values in the column.
Column stats doesn’t explicitly provide stats about the nonblank cells. You will have to deduce this from the number of Empty cells and the number of Total rows to get the number of nonblank cells in the column.
Nonblank cells = Total rows - Empty cells
In this example, you can see there are 1000 - 985 = 15 non-blank cells in the data.
What if you want to see the empty cells within a selected range?
Unfortunately, you can’t do that. Column stats currently doesn’t provide the option to select the rows.
As a result, it may not be the most convenient option to count nonblank cells.
Count Non-blank Cells with Explore
Explore is a feature in Google Sheets that can give you quick insights into your data.
It provides you with instant charts and graphs for spotting trends and getting quick summaries of some basic metrics. You can also use it to ask questions about your data.

You will find Explore at the bottom right-hand corner of your spreadsheet.
Alternatively, you can use the keyboard combination Alt + Shift + X.
The Explore panel opens to the right of the spreadsheet. Follow these steps to use it to count the nonblank cells in your data.
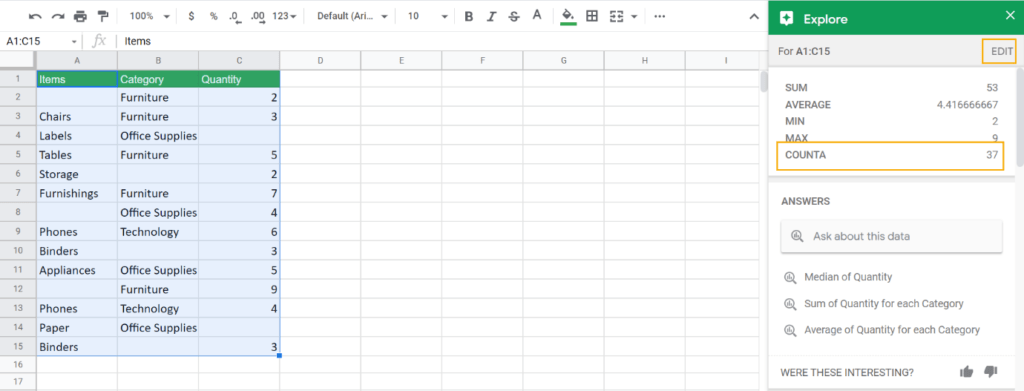
Select the range of cells, then click on Explore. The COUNTA value will show you the count of nonblank cells in your data.
If you want to see the COUNTA on a column basis, click on EDIT.

Click on the grid icon to open the Select a data range dialogue box. Use the cursor to select the range or the range cell references.
When you’re done, click on the OK button.

Use the Headers option to select the number of rows that contain column headers. Then click on UPDATE to save your selection.

The cell range has changed to reflect the new selection, but the COUNTA value hasn’t. In fact, all the other values haven’t been updated either.
If you encounter this same challenge, no need to panic.

Just go into the data and select the range. Now, the correct COUNTA value is on display.
There’s more you can get from Explore.

You can get different charts and graphs to analyze your data. You can even insert charts into your spreadsheet by dragging and dropping them from the window pane into the sheet.
The MORE option gives you access to other charts that may not be on display because of insufficient space.

Other options available in Explore are ANSWERS, PIVOT TABLE, and FORMATTING.
Count Non-Blank Cells with the COUNT, COUNTA, COUNTIF, and COUNTBLANK Functions
The spreadsheet has several functions for counting items in a dataset. You can use various functions such as the COUNTA, COUNT, COUNTIF, and COUNTBLANK functions to count nonblank cells.
COUNTA Function
The COUNTA function counts all the numeric and text values within a defined range.

= COUNTA ( value1, [value2, …] )The value1 argument is the only required argument in COUNTA. This refers to the range of cells whose value you want to count.
You can include additional ranges with the other optional arguments. COUNTA can take up to 30 arguments.

= COUNTA ( B2:B7 )Copy and paste the above formula into an empty cell to count the number of nonblank cells in Column B.
You can expand the size of the range or add more ranges as you like.
COUNT Function
You can also use the COUNT function to count all the nonblank cells in your data. But this will only count number values in your dataset.

= COUNT ( value1, [value2], …] )The COUNT function has the same arguments as COUNTA.

= COUNT (B2:B7)You should note that the COUNT and COUNTA functions, although very similar, differ quite slightly in terms of what they count.
COUNT will only count the numeric values in your data. If you have text in the data, COUNT will ignore it. COUNTA, on the other hand, will count both text and numeric values.

A text value has been entered In column B. Consequently, the COUNT and COUNTA functions returned different results.
If you want to count the nonblank cells in a large dataset with multiple variables, it is best to stick with the COUNTA function.
COUNTIF Function
COUNTIF is like a modified IF function for counting items. It allows you to count items that meet a specific criterion.

= COUNTIF ( range, criterion )COUNTIF has two arguments which are range and criterion.
- range is for specifying the cells where you want to perform the counting task.
- criterion is where you specify the criteria for counting. All characters in the criterion argument must be enclosed in quotation marks for all comparison operators.
The only times this rule can be violated is when you’re using the equal = operator or a formula.

= COUNTIF ( B2:B7, ">0" )or
= COUNTIF ( B2:B7, ">" & 0 )With this syntax, we’ve counted all the values in the column that are greater than 0.

= COUNTIFS ( criteria_range1, criterion1, [criteria_range2, …], [criterion2, …] )You can achieve the same thing with the COUNTIFS option. With COUNTIFS, you can count based on multiple criteria. Additional ranges must have a similar number of rows and columns as the first range in criteria_range1.

= COUNTIFS ( B2:B7, ">0" )If you have only one count criterion, COUNTIFS will work just like COUNTIF.
Blank cells are interpreted as having a zero value so these formulae will return a count of the non-blank cells.
COUNTBLANK
COUNTBLANK counts the number of blank cells in a range, but you can use it to count the number of nonblank cells if you know the total number of cells in your range.
= COUNTBLANK ( value1, [value2, …] )The COUNTBLANK function has the same argument as the COUNT and COUNTA functions.
= MULTIPLY ( ROWS(B2:B7), COLUMNS(B2:D2) ) - COUNTBLANK ( B2:D7 )The ROWS function returns the number of rows in a range, and the COLUMNS function returns the number of columns in a range.
By multiplying the results of both functions using the MULTIPLY function, you get the total number of cells in the range.
When you subtract the number of blank cells returned by the COUNTBLANK function, this gives the number of nonblank cells in the range.
Count Non-Blank Cells with the QUERY Function
The QUERY function can help you count the number of nonblank cells in your data as well.
Check out this guide for more details on the QUERY function.

= QUERY ( data, query, [headers] )QUERY function has three arguments.
- data refers to the range that contains the data you want to query.
- query is the computation you want to carry out on data entered using an SQL-type syntax or command. The query argument must be enclosed in quotation marks.
- headers is used to specify the number of rows containing column headers in your data. It is optional, but if left black, the function will guess the column headers.

= QUERY ( B1:D7, "select count (C)", 1 )Copy and paste the syntax to count the nonblank cells in the Office Supplies column.
Note: The count within the query syntax will only count number values, so this solution will only work when you have a column of numbers.
Count Non-Blank Cells with a Pivot Table
A pivot table is a special feature that helps you to summarize your data so you can easily explore and report on various trends.
You can filter, group, sort fields within a pivot table as well.
Pivot tables allow you to generate different kinds of summaries about your data such as sums, minimums, maximums, counts, and averages.
Additionally, you can easily view data from a different perspective, which is the idea behind the “pivot” name.
Creating a pivot table in the spreadsheet is very easy.
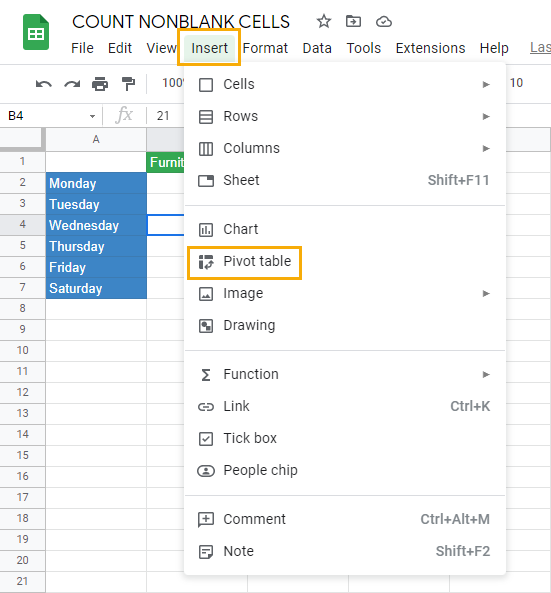
Go to the Insert menu and select the Pivot table option.

The Create pivot table dialogue box has two sections.
In the Data range section, you can choose the range of data to include in the pivot table.
The pivot table automatically picks up the whole range of data in the existing sheet. You can easily use the table icon to select the data you want to use.
The Insert to section is where you choose the location for your pivot table.
The New sheet option is always selected by default. Click on the Existing sheet radio button if you want to keep the pivot table in your existing sheet.
For this example, you can insert the pivot table into the Existing sheet.

When you select the Existing sheet option, you will have to specify the location in the existing sheet where you want to place the pivot table.
This can be a range or a single cell. Use the table icon to select the cell where you want the pivot table to be.

After you choose your location, press the OK button.

When you click on the Create button, the pivot table will be inserted into the existing sheet.

In the Pivot table editor, you have four options for organizing your data. The pivot table uses the first row as a column header. This makes referencing easier, so it’s important that you name your columns.
The column headers are grouped in the right-hand section of the Pivot table editor. Drag each section under the Values option.
Note: Only columns containing numbers should be added in the Values section.

When you add data to Values, the numbers are automatically summed up. Use the Summarise by option to change the calculation type to COUNTA.

This way you will have counted the number of nonblank cells in each column.

You can make the values appear in rows by changing the Values as option to Rows.
Now you have the nonblank or nonempty counts from each of the columns in your dataset.
Conclusions
When you count the nonblank cells in your data, you will know how complete your data is.
The Status bar, Column stats, and Explore options are easy ways to get counts at a glance, though extra mental arithmetic might be needed to infer the nonblank counts.
The COUNT and COUNTA functions can easily return the counts of nonempty cells of numbers or numbers and text.
Asides from counting nonblank cells, the COUNTIF, COUNTIFS, and QUERY functions can be used to find the number of times a certain attribute appears in your data.
Pivot tables are a powerful way to summarize your data and this includes counting values.
When it concerns counting anything in your data, there’s really no limit to how you can use these methods.
Do you use other methods for counting non-blank cells that haven’t been discussed here? Let us know in the comments!


0 Comments