One thing Google Sheets lack is the ability to add table objects to store your data. There is no such option under Google Sheets to add a table for a selected range.
It sometimes compromises the readability of the data. If you are working with data with multiple columns and thousands of lines, the standard black and white layout can be difficult to read.
You can add alternate colored rows inside Google Sheets and make the selection look like a standard table-like structure.

There are several ways to color alternate rows inside Google Sheets, and you will learn all of these tips to make your data more readable. Get the example workbook to follow along.
Dataset

Suppose you are an analyst who manages the inventory for your organization and comes with data every now and then that has the following columns.
- Order ID, Order Date, City where the transaction happened, Province, Country, Item Category, Item sold, Quantity, Base Price, Sale Price, and Line Total.
The data looks as shown in the screenshot above. Since this data set is quite wide, it can be hard to keep track of which row you are looking at and you might end up mixing up data when scanning through a row.
Adding alternating colors will help you distinguish between rows as you read from left to right.
Another great option for making it easier to read your dataset is to freeze the column or row headings. This way when you scroll down or to the right, they will still be visible.
Keeping your entire dataset visible on-screen might also be possible by zooming in or out as needed.
Add Alternating Row Color from the Format Menu
Google Sheets has come a long way. Previously, if you wanted to color the alternate rows you only had conditional formatting as an option in combination with a custom formula.
Otherwise, the only other option was to manually apply the color format to cells in each alternate row.
Fortunately, they have developed a separate option through the Format menu to color the alternate rows.
This feature only colors the alternate rows, and if you want to color the specific Nth rows, there is still no better option than conditional formatting.

Select all the rows you want to add the alternate colors. While doing so, make sure to add the headers as well in this selection. In this case, the selection should be A1:K20.

With the data selected, click on the Format menu to open up various formatting options. Click on the Alternating colors option. This will open up an Alternating colors window on the extreme right of the sheet.

You will see the Alternating colors window opened up on the extreme right of the sheet. Inside it, make the following amendments.
- You can see the Apply to range option where the range to apply aternate colors is mentioned. You can change the range if you are not ok with the current selection.
- Tick select the Header option through Styles section. If you don’t have headers in your data, no need to select this option.
- Select from the Default style options to add alternate color to your rows. If you don’t like the default styles, there is an option to create a Custom colored layout by selecting the Header, Color 1, and Color 2 combinations as per your choices.
- Once you are happy with the layout, click on the Done button to complete the setup and you will see that the alternative rows are now colored.
Use the Custom option if you want to choose your own colors or you can even use a hexadecimal color code to select colors.

After the layout is applied and alternating rows are colored, your data will look more readable.
📝 Note: If you add new rows below the selected range, Google Sheets is intelligent enough to add the alternate row colors to those as well. It is also true if you add the rows in between or above any of the formatted rows.
Add Alternating Row Color from the Toolbar
Another way of adding the alternate color to your rows is through the Toolbar.
There are various tools available under it, but you can find the alternating color option inside the Fill Colors tool.
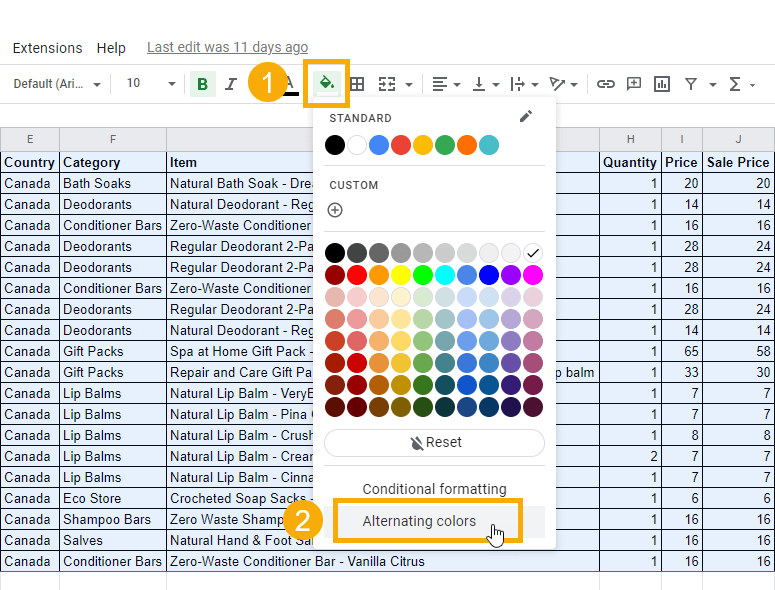
Select all the rows that you want to add alternate colors from the spreadsheet.
- With rows selected, navigate towards the Fill Color tool from the Toolbar and click on it to open all the available options.
- At the bottom of the pane, you will see the Alternating colors option. Click on it to access the menu and follow the steps same as the previous demo to choose and apply the alternating color to your data rows.

There is another way to add alternating row colors manually through the Fill Color tool.
First, you have to select the alternate rows manually in your spreadsheet. It is a tedious job, and You have to hold the Ctrl key every time you try and select the new row using your mouse pad or mouse.
The selection looks like the one shown in the screenshot above. If you want, feel free to add the header row as well in this selection. In that case, you will have to select all the odd rows compared to the one shown in the screenshot above.

Navigate to the Fill color from the Toolbar and select a specific color you want to fill these rows. Select your choice color.

Once you click on the desired color, it will be applied as a fill to all the rows you selected.
You are free to add a color of your choice to the header row as well. However, it is optional, and in this demo the header is kept simple black and white.
📝 Note: When you add rows to the bottom or insert rows, you will need to reapply this formatting manually.
Add Alternating Row Color from the Explore Menu
Being a lazy efficient data analyst, I always look for better tools to do my task.
What if you have a tool that can do a quick data analysis for you and let you know the total Sales amount of Lip Balms sold? Or give you a pivot layout readymade based on the data provided? Or generate charts? Or apply alternate coloring to the rows?
Wouldn’t you be amazed? Well, you should be!
The Explore tool inside Google Sheets does various analyses with the help of AI and Machine Learning from Google to help you understand the context of the data.
It also provides intelligent solutions such as visualizations, pivots, summarization, or answers to your plain language questions.
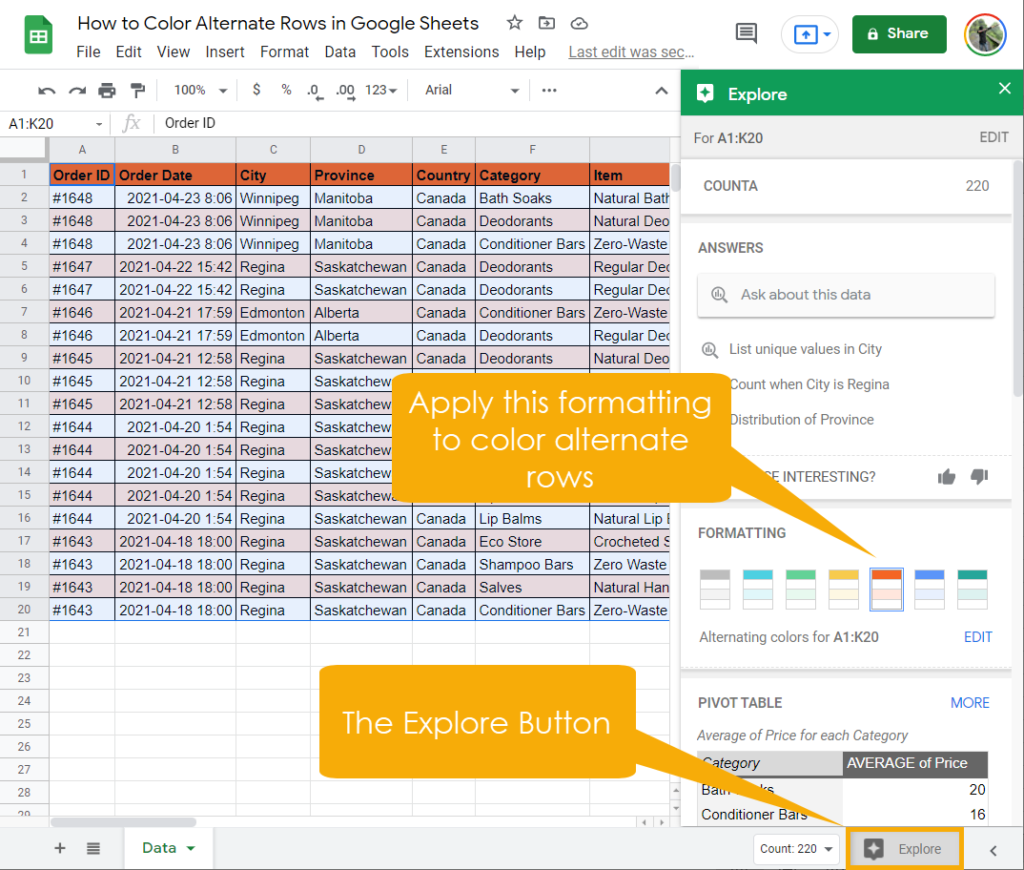
It will also allow you to add alternate color formatting to your rows. You can see the Explore button at the extreme right of the Status Bar.
- Firstly, you select the entire range you want to apply alternate row colors on. In this example, the range is A1:K20.
- Click on the Explore button at the extreme right on Status bar. Alternatively, you can also open the Explore menu using a keyboard shortcut Alt + Shift + X.
- As soon as you click on the Explore button or hit the shortcut, a window will pop-up with variety of options to explore with your data. Under the Formatting section, you can see the alternate color format is available. You can select any of the formatting choices to apply it to the rows in your data.
This is indeed cool, isn’t it?
I bet you would never have thought that the Explore menu could be utilized to answer quick questions about your data along with formatting the rows with alternate colors.
Impress your colleagues by using the tool to answer quick questions about the data. 😉
Add Alternating Row Color with the Conditional Formatting
Before the addition of the Alternating color feature in Google Sheets, Conditional Formatting was the only available option to add alternating color to the rows.
Using Conditional Formatting, you could change the cell color, text color, font size, or any other formatting based on a specific rule.
In order to format only the alternating rows, you will need to use conditional formatting based on a formula.

To add alternating color to your rows using Conditional formatting, the first step is to select all the rows.
With rows selected, navigate select the Format menu and click on the Conditional formatting option. As soon as you click on that option, the Conditional format rule window will open at the extreme right of the sheet.

Inside the Conditional format rule window, you want to go with a Single color option while adding alternating color to the rows.
If you have numerical data and want to change the color based on the magnitude of cell values, the Color scale option is best for you.
Under the Format rules section, expand the dropdown and select the Custom formula is option to add a custom formula to color the alternating rows.

= ISEVEN ( ROW ( ) )Inside the Value of formula box, add the above formula.
The ROW function returns the row number of the current cell, and the ISEVEN function then checks if that row is even or not. If the row is even, it will return the logical output TRUE and get the formatting applied, else it will return FALSE and get no formatting.
Under the Formatting style, go to the Fill color option and choose a color of your choice to fill the even rows with. Hit the Done button to apply this formatting on the selected rows.
You can now see that all the even rows are filled with this color.

You are free to add alternating color to the odd rows with another Conditional format rule.
You have to click on Add another rule option and then follow the same procedure as above. However, instead of using the =ISEVEN(ROW()) formula, this time, go with the =ISODD(ROW()).
Choose a different color of your choice for odd rows, and that’s it!
📝 Note: If your rows were previously colored and you apply Conditional formatting or Alternating colors method on those rows, the system will overlap the old row colors with the new ones. However, the old colors are still there, and as soon as you remove the current row color formatting, the previous one will become visible.
Add Row Color Every Nth Row with Conditional Formatting
What if you have to focus every 3rd, 4th or 5th row?
For example, what if you have a quarterly sum appearing after every three rows? And you want to add a row color there so that you could identify it more quickly?
The Conditional formatting option will help you color every nth row from your database starting from either the first row or a specific row number.
You can create a custom formula to produce the desired result by combining the MOD and ROW functions.
To color every fourth row in the data you have, select the entire range and go to the Format menu. Click on the Conditional formatting option that opens up the Conditional format rules window.

Inside the Conditional format rules window, stick to the Single color option. Under the Format rules, click on the dropdown to select the Custom formula is option.
= MOD ( ROW ( ), 4 ) = 0 It will allow you to add a formula based on which rows should be colored. Add a the above formula under the Value or formula section.
The ROW function returns the row number inside the MOD function, which returns the remainder on division.
The second argument inside the function is for the divisor. Since you want to color every fourth row, the divisor should be 4 in this case.
You are asking the formula to return the reminder once it divides the row number by four. The = 0 argument decides whether the reminder is 0 or not.

Once you set the formula up, select a color of your choice to add to those rows through the Fill color option from Formatting style and hit the Done button to apply it on the given range.
You should now see that the system has colored every fourth row in the selection.

- Note 1: When this formula starts working, it counts from the first row starting from headers. In that case, it does color the fourth, eighth, twelfth rows etc. If you want it to ignore the first row from the formula to count, just change the formula to
=MOD(ROW(A1:K20)-ROW($A$1), 4) = 0. And it will now start counting from row 2 onwards. The formula has colored the rows starting from the headers and every fourth row after that. - Note 2: If you want to color every 5th row, change the divisor to 5. In general, if you want to color every nth row appearing, you set the divisor as n in the formula.
Add Alternating Row Color with Apps Script
If you are working with Google Sheets, Apps Scripts are inevitable at some point.
It is a perfect tool for automating day-to-day tasks using the JavaScript-based cloud platform.
If you are new to Apps Script, then check out our Google Apps Scripts guide for beginners.
You can also add alternating row colors using the Apps Script with the help of the applyRowBinding() class and its related properties.

Open up the Apps Script environment. Click on the Extensions menu and select the Apps Script option. The Apps Script environment will launch into a new browser window and looks like the one given above.
Please note that I have changed the Project name to the title of this article. You can see how to change it through our reference article mentioned above.
Use the script below to add alternating row colors to the range A1:K20. You can copy and paste the code directly into your Apps script environment.
// Script to Add Alternate Row Colors
function setAlternatingRowColors() {
  var spreadsheet = SpreadsheetApp.getActiveSpreadsheet();
  var range = spreadsheet.getRange("A1:K20");
// apply alternate row colors
  range.applyRowBanding(SpreadsheetApp.BandingTheme.PINK);
}
Here is what the above code does.
- You first define the function on first line that will hold the code for you. Name it whatever you want, in this case, it is named as setAlternatingRowColors().
- on the second line, the SpreadsheetApp.getActiveSpreadsheet() class will access the currently active spreadsheet and the result is stored into the spreadsheet variable. The var clause defines a variable for you here.
- The range variable stores the active sheet range A1:K20 and the getRange() method is used over spreadsheet variable to get the same.
- Now, the applyRowBanding() class allows you to apply a specific banding theme to the range selection. The SpreadsheetApp.BandingTheme.PINK method allows you to apply the pink theme to the rows.

Once you click on the Run button, the code will start to execute, and you will see the Execution log on the bottom side, as shown in the GIF above.
If you are accessing the Apps Script for the first time, it will ask you to authorize the project. Once the script executes error-free, go to the worksheet, and now you can see that the alternating rows are now colored.
Remove Alternating Row Color
Up to now, you have seen how to add an alternating row color to your data. However, it is equally essential to know ways of removing the alternating row colors as well.
Remove Alternating Row Colors through the Format Menu
To remove alternate row colors, navigate towards the Format menu and click on it. Select the Alternating colors option. Your actions will open up the Alternating colors window on the right-hand side of the sheet.

At the bottom of the Alternating colors window, you will see the Remove alternating colors option. Click on it to remove it from the selected range A1:K20.
Remove Alternating Colors through the Conditional Formatting
To remove the alternating row colors that have been applied with conditional formatting, go to the Format menu then click on the Conditional formatting option.
It will open up the Conditional format rules window at the extreme right of the sheet.

Inside the Conditional format rules window, you can see the conditional formatting rule with a custom formula in it.
Click on the trash can icon to remove that rule from your selected range A1:K20.
Apps Script to Remove Alternating Row Colors
To remove the alternating row colors using the Apps Script, use the script below. You are free to copy and paste it to your Apps Script environment. You can access the Apps Script through the Extensions menu.
//Script to Remove Alternate row colors
function removeAlternatingRowColors() {
  var spreadsheet = SpreadsheetApp.getActiveSpreadsheet();
  var range = spreadsheet.getRange("A1:K20");
// remove altenate row colors
  range.getBandings().forEach(banding => banding.remove());
}- The function is named removeAlternatingRowColors().
- The spreadsheet and range variables are same from the previous script.
- There is the banding.remove() method defined through the banding variable forEach row of the range. It is applied on the range.getBandings() class.

Click on the Run button to execute this script. You will see the Execution log at the bottom-hand side of the Apps Script. If the code is error-free, you will see a message as Execution Completed.
If you now check, the alternating colors have been removed from the data.
Clear All Format to Remove Alternating Row Colors
Another option to remove any alternating row colors from your data is to clear all the formatting from the selected range!
Check out this post to see all the ways you can clear formatting from your data.
Conclusion
For years, the only way to add alternating colors to the rows in Google Sheets was the Conditional Formatting.
However, Google Sheets now provides a quick Alternating colors tool through the Format menu as well as through the Toolbar to do this task quickly.
You can also still use Conditional Formatting to color alternating rows and it is the only way to color every nth specific row in Google Sheets.
Apps Scripts can be used to add alternating colors to selected rows. However, the Apps Scripts are usually slow to do the task and can affect your work speed in Google Sheets.
The article has shown you all the possible way to add alternating row colors inside Google Sheets. Which is your go-to method? Let me know in the comments section!


0 Comments