This post will show you various ways you can find the slope of the best fit line for your data in Google Sheets.
Data is vital to any successful organization. But gathering and collecting data is just part of the process. To gain knowledge, data must be processed and interpreted.
There are various techniques for analyzing and interpreting raw data, depending on the objective. One widely used technique of analysis is to find the best fit line in order to predict future outcomes.
There are different methods that you can use to calculate the slope of your data in the spreadsheet. In this article, we will discuss these methods.
- How to calculate the slope from first principles.
- How to use the SLOPE function.
- How to calculate the slope with the Graph Trendline Label Equation.

Get your copy of the example workbook from the above link and follow along.
What is the Slope?
Before we dive into all the methods available for calculating the slope of the best fit line, you need to understand what the slope really means.
The slope is used to identify the direction and calculate the steepness of a line. This concept is used in all areas, from finance to engineering.
When a line is plotted on a graph, the slope is calculated by taking the difference of the change in the values of the coordinates on the Y-axis and dividing it by the corresponding difference of the change in the values of the coordinate on the X-axis.
The direction of the line will indicate the type of relationship that exists between the X and Y variables.

A line that goes downwards from left to right will have a positive slope and therefore a positive relationship will exist between the Y and X variable. This means an increase/decrease in X will lead to an increase/decrease in Y.

A line that goes downwards from left to right has a negative slope, and thus indicates a negative relationship between the Y and X variables. This means an increase/decrease in X will lead to a decrease/increase in Y.
The slope of a line is expressed in numbers. A larger number indicates a line that is very steep while a smaller number shows that isn’t very steep.
Why Calculate the Slope?
After understanding the concept of slope, what is its implication and why might you want to use it.
The slope is used for identifying the steepness of a line, but it has further implications. The slope is actually the basis and foundation for the calculation of change or rate of change.
The slope lays the foundation for other concepts such as in Calculus, which is the calculation of the rate of change along non-linear curves. And Regression is used for identifying cause and effect relationships between two or more variables.
In calculating how steep a line is, the slope takes into consideration how a variable Y changes with respect to a variable X.
Y is the dependent variable, and X is the independent variable. This means changes in Y depend on the changes in X.
Asides from calculating the rate of change between two variables, it’s also used to identify the direction of the relationship between variables, whether positive or negative.
Suppose the Y variable represents the sale amount of an item, and the X variable represents the price of an item.
By collecting price and sales data over a period, and plotting the graph of the two variables, the slope of the two variables will help us to understand how the changes in the price have affected sales.
In a positive relationship, the sales will increase as price increases, while the opposite will hold true for a negative relationship.
Since the slope is useful for calculating the rate of change of variables over time, it has found great use in predictive models.
The slope makes it possible to identify trends, and derive an equation that explains the relations between the dependent and independent variables.
This equation can then be used to predict the effect of changes in the independent variable. It also helps with the identification of variables that have the biggest impact on the dependent or output variable.
You will understand better when we start to apply the concept in the preceding sections.
Calculate the Basic Slope from First Principles
The equation of a straight line in mathematics is given as follows.
y(x) = m*x + cyis the dependent variable.xis the independent variable.mis the slope or gradient.cis a constant value given byy(0)when the line equation is evaluated atx = 0.

The formula for finding m is as above where y2 and x2 are known as current values and y1 and x1 are known as base values.

How can you apply this knowledge to find the slope of the above sample data?
First, we have to identify our x and y values. The values in the Month column will be our independent or x variable and the sales Revenue column will be our dependent or y variable.
Since we want to find the rate of change of Sales Revenue over 12 months, we will set our base and current y and x values as follows.
- y2 = $410
- y1 = $9.71
- x2 = 12
- x1 = 1

= ( B13-B2 ) / ( A13-A2 )Using the above formula, you can calculate the slope of the sample data.
= DIVIDE ( MINUS ( B13, B2 ), MINUS ( A13, A2 ) )You can also use the above syntax to derive the same result.
What does the number indicate?
Remember you’re looking for how much Sales Revenue changes with respect to time as changes in Month. The number tells us that Sales Revenue increased by an average of $36.39 every month for the past 12 months.
It also tells us that there’s a positive relationship between Month and Sales Revenue.
y = $36.39x + cIf you were going to represent this as an equation, it would look like the above.
You will just need to determine the constant value c in the equation and then you can use this to predict the Sales Revenue for the coming months. We just need to manipulate the value of x to reflect the number of months we want to predict.
Calculate the Slope with the Least Square Method
The Least Square method is perhaps the most frequently used method of regression analysis.
Most of the functions in the Google Sheets that can be used for calculating the slope of a line are based on the Least Square method.
The Least Square method is one way to find the best fit line based on a sample of data.
The line of best fit is the line that best describes the linear relationship that exists between the dependent variable and independent variable(s).
The line of best fit is the slope. When you’re looking for the slope of a line or doing a regression analysis, you’re looking for the line of best fit.
Why do you need the line of best fit?
Because variables rarely exhibit a directly proportional relationship.
The Least Squares method allows you to easily fit a line that best describes the nature of the linear relationship that exists between the sets of data points of variables.

Using the scatter plot of the sample data, it’s immediately clear that a positive linear relationship exists between both variables. But this linear relationship isn’t proportional as Sales don’t increase at the same rate of a change per Month.
If you want to find the equation that best summarizes the relationship between both variables, that is the line that best fits the data points, you will need to find the slope and intercept.
The Least Square principle serves as the foundation for making these calculations and achieving reliable results.
The principle of Least Squares says that the line of best fit will be at the point where the sum of squares of the residuals (deviation from the mean) is at its minimum.
In other words, this line will be the one that is as close as possible to all of the data points. Hence, the line of best fit.
To get the line of best fit (slope) for the sample data using the Least Square method, you can recall the straight-line equation.
y = mx + cand use the following formula to find m and c.
m = Σ(x - x̄)(y - ȳ) / Σ(x - x̄)2c = Σy - mΣx / nȳis the mean of y.x̄is the mean of x.nis the number of observations.
You will notice that the formula for finding m here differs from the formula used to find m in the basic slope calculation.
The reason for the difference is the Least Squares method uses all the individual data points in the calculation to account for variation around the mean value.
The basic method doesn’t account for variation around the mean value and it only calculates the line based on two data points.
Follow these steps apply this formula to your spreadsheet.
- Identify your dependent and independent variables. From the sample data case.
- Month is the independent x variable.
- Sales is the dependent y variable.

= AVERAGE ( A2:A13 )
= AVERAGE ( B2:B13 )- Use the above formulas to get the mean values for columns A and B.

- Create new columns for x-x̄, y-ȳ, (x-x̄)2, and (x-x̄)(y- ȳ) and use the following formulas to get the values for each column.
- x-x̄
=A2-$A$14 - y-ȳ
=B2-$B$14 - (x-x̄)2
=C2^2 - (x-x̄)(y- ȳ)
=C2*D2

= SUM ( E2:E13 )
= SUM ( F2:F13 )- Use the above formulas to get the sum of the values in columns E and F.

= F14 / E14Divide the sum of the values in column F by the sum of the values in column E to obtain the slope.

You can also calculate the intercept or c value using the provided formula.
= SUM ( A2:A13 )
= SUM ( B2:B13 )- Get the sum of columns A and B.

= DIVIDE ( MINUS ( B16, 34.37 * A16 ), 12 )- Copy and paste the above formula to find the intercept of the line.
Sales = $34.37(Month) – $82.44Using the results from the calculations, the straight-line equation that best fits the sample data is above.
You can use the values of these results to plot your line of best fit on your data.
The Least Square method might appear as a mechanical way of calculating the slope of a line, but it can help you to better understand the processes and principles involved in the development of predictive models.
A mastery of the concept of Least Squares can help you identify if a dataset can provide good predictive models by simply studying the amount of variation within it.
Calculate the Slope with the Graph Trendline Label Equation
Using the graph trendline method is a highly effective method for calculating the slope of the best fit line.
It produces more accurate results because it uses less rudimentary computations to derive a better fit line. Behind the scenes, it will perform a least-squares calculation to determine the equation of the best fit line.

This method of finding the slope of this sample data will be using a line chart. You can also use a Scatter Plot.

Go to the Insert menu and select Chart from the options.

A chart is inserted into the spreadsheet when you click on the chart. The type of chart that will be inserted will depend on the type of chart that was recently used.

A Chart editor opens up to the right of your spreadsheet. Click on the Chart type section and select the Line chart type.

In the Data range section, you will select the range of data you want to include in the chart. You can also select the data range prior to inserting the chart and the range will be picked-up automatically when you insert the range.
The X-axis section is where you define the range that contains the independent variable in your data.
This section can take both categorical and continuous variable data types. Categorical data are data that are discrete and have clear differences. Data that often fall within this definition are gender, month name, product categories, etc.
Continuous data is usually represented by numbers, for instance, temperature, age, sales, profit, etc.
In this sample, the Month column contains our independent variable data.
Series is where you identify the range that contains your dependent variable. From the sample data, the Sales Revenue column contains our dependent variable.
You also have other options you can activate. The Add Series option allows you to add new variables to the chart. These would be shown as new lines in the chart.
The other options in the Series section include the Switch rows/columns, Use row 1 as headers, and Use Column A as labels. Unlike the X-axis section, Series only takes numeric data.
When setting up your chart, it’s important that you identify the dependent and independent variables in the data range you’re working with. This is necessary for producing accurate results and making the right conclusions and interpretations.

After you’re done with the Setup section, go to the Customise section and click on Series.
Remember, Series also refers to the dependent variable in your data or the Y-axis of your graph.

Go to the bottom of the list and click on the Trend line checkbox.

A straight line appears on the graph. From the direction of the line, you can tell that there’s a positive relationship between both variables.
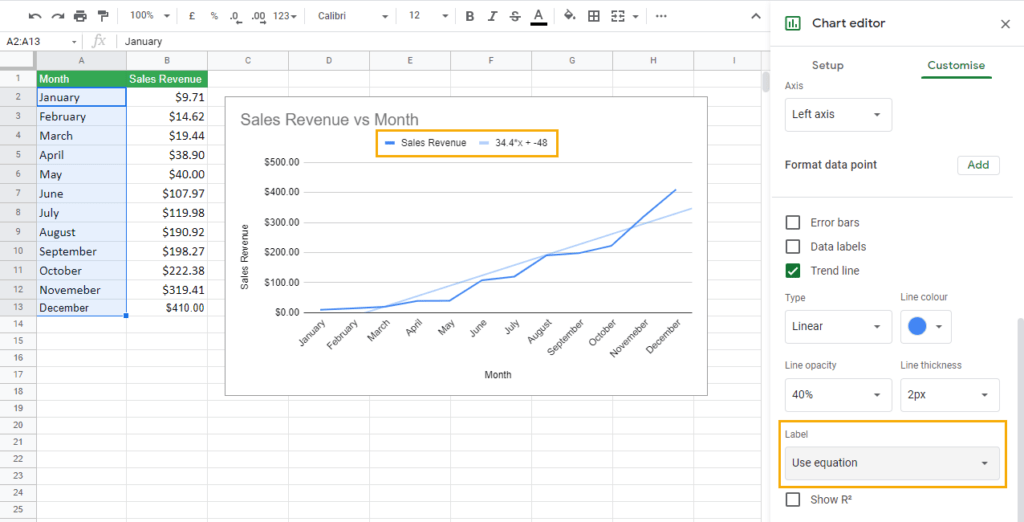
o to the Label section and select Use equation. This option will display the linear regression equation on the graph.
The equation Sales Revenue = 34.4*X + -48 is now displayed on the graph.
What is this equation telling us?
We already know that there’s a positive relationship between our Sales Revenue and Month. But how much of a relationship is there? How exactly do they relate to each other?
Answering these questions is why the equation is important. From the equation, we know that every month brings about a $34.4 increase in Sales Revenue.
This number is a slight difference from that derived from the first formula. This is because the formula used assumed a linear or direct relationship between both variables.
But as you can see in the graph, the relation isn’t quite linear.
This method also gives a value for c. In the equation shown, c = -48. This means when x = 0, Sales Revenue is -48.
You can see that knowing the direction of the relationship between variables isn’t enough, you also need to know the magnitude of that relationship.
Although two variables may be positively or negatively related, the magnitude of correlation might be negligible or insignificant.

The graph trendline method allows you to take your analysis a notch further with the Coefficient of Determination (R2) option.
R2 is a statistical tool that is used to identify how much variation in the independent variable is explained or accounted for by the dependent variable.
You can get the value of R2 by checking the Show R2 box in the Customize tab.
The R2 value can help us understand how much of the change in Sales Revenue is due to a change in Month.
You will need to multiply the value of R2 by 100 for easier interpretation. In our sample, R2 = 0.904 or 90.4%. This means a change in Month accounts for over 90% of the changes seen in Sales Revenue.
Now you’re sure variation in Month is of crucial importance to the bottom line.
This information can lead to more investigation into the factors that make sales depend heavily on Month variation. It can also lead to research that can identify the other variable that forms the remaining 10% variation that is not accounted for in this equation.
Calculate the Slope with the SLOPE Function
Instead of creating graphs and trendlines, Google Sheets has the SLOPE function which allows you to directly calculate the slope of the best fit line using linear regression.
It’s a simple and easy way to find the steepness and relationship of two variables.

= SLOPE ( data_y, data_x )data_yis the array of data containing your dependent variabledata_xis the array of data containing your independent variable
You must note that only numeric values work with the SLOPE function. You will have to modify the Month column.

Instead of using month names, the months will be represented with numbers.

= SLOPE ( B2:B13, A2:A13 )Copy and paste the above formula into an empty cell. The result is the same as the one from using the chart and trendline method.
While this is a quick and easy way, there are obviously a few limitations to using the SLOPE function.
Your data cannot contain text values. If you have categories and price as variables, you will need to convert the categories to a numeric value if possible.
The other restriction is the inability to derive a Coefficient of Determination value which is easy when you use the chart and trendline method.
Nevertheless, the strength of the SLOPE function lies in its ability to produce quick and straight-to-the-point results.
Calculate the Slope Using the FORECAST & INTERCEPT Functions
You can combine the FORECAST and INTERCEPT functions to calculate the slope.

Syntax for the FORECAST Function
The FORECAST function returns the expected value of your dependent variable. You can use the FORECAST function to find the expected Sales value for the thirteenth month based the sample data.
FORECAST uses the Least Square principle, so it will return the same result as the other methods, only without the equations. It simply is a quick and easy way to make forecasts.
= FORECAST ( x, data_y, data_x )xis the value of the independent variable that you want to use to make the forecast.data_yis the array containing the dependent variables in your dataset.data_xis the array containing the independent variables in your dataset.
Syntax for the INTERCEPT Function

The INTERCEPT function returns the value of c from the straight line equation. That is, the value of the dependent (y) variable when the independent variable (x) is zero. Its arguments are also similar to that of the FORECAST function.
= INTERCEPT ( data_y, data_x )data_yis the array containing the dependent variables in your dataset.data_xis the array containing the independent variables in your dataset.
Calculate the Slope
Using both the FORECAST and INTERCEPT functions, you can calculate the slope of the sample data.

= FORECAST ( 1, B2:B13, A2:A13 ) - INTERCEPT ( B2:B13, A2:A13 )Copy and paste the above formula into an empty cell and you will get the slope of the sample data. This syntax will subtract the value of the INTERCEPT from the FORECAST value.
= FORECAST ( 1, B2:B13, A2:A13 ) - FORECAST ( 0, B2:B13, A2:A13 )Alternatively, you can use the above formula which only uses the FORECAST function.
The maths behind this is simple.
Remember, the equation of a straight line y = mx + c.
If you solve this equation for m then you get m = (y – c)/x.
The FORECAST function provides y values for when x is 1, and the INTERCEPT provides the value for c. Hence, arriving at the value for m.

= FORECAST.LINEAR ( x, data_y, data_x )The FORECAST.LINEAR function has the same argument as the FORECAST function, and it also works the same.
= FORECAST.LINEAR ( 1, B2:B13, A2:A13 ) - INTERCEPT ( B2:B13, A2:A13 )
= FORECAST.LINEAR ( 1, B2:B13, A2:A13 ) - FORECAST.LINEAR ( 0, B2:B13, A2:A13 )
Using either of formula syntaxes will also return the same slope result.
Calculate the Slope Using the LINEST Function

LINEST is useful for calculating the slope from a dataset, but it can do so much more. You can use the function to carry out deeper statistical tests that are useful for confirming the reliability of the relationship among variables.
With LINEST, you can calculate the standard error, degree of freedom, regression and residual sum of squares, F-statistic, and the coefficient of determination.
= LINEST ( known_data_y, [known_data_x], [calculate_b], [verbose] )known_data_yis the array containing your dependent variables. This is the only required argument in the function, and it’s all you need if you want to calculate the slope.known-data_xis the array containing your dependent variables. This is an optional argument.- If
known_data_yhas two rows of data, thenknown_data_xmust have similar dimensions or must be omitted. - If
known_data_yhas only one row,known_data_xcan have a two-dimensional array. However, each row in theknown_data_xwill be interpreted as separate independent variables, that is, X1 and X2. The same thing also applies whenknown_data_yis a single column.
- If
calculate_bthis argument calculates the intercept of the equation. It is optional and is set to TRUE by default.verbose– this is the argument you can use if you want the function to return the values of the other statistical tests mentioned earlier. It takes a TRUE or FALSE operator and can be completely omitted.

= LINEST ( B2:B13, A2:A13, true )Using the above formula syntax, you can use LINEST to calculate the slope.
Note: This formula returns an array with two values. It returns both the slope and intercept values in the line equation.
Calculate the Slope Using the TREND Function
Another function you can use to calculate the slope is the TREND function. It also returns the expected future value of the dependent variable based on a given value of the independent variable.

= TREND ( known_data_y, [known_data_x], [new_data_x], [b] )TREND has 4 arguments, but only one is compulsory. The known_data_y, known_data_x, and b are similar with those obtainable in the LINEST function.
The new_data_x argument refers to the value of the independent variable against which the forecast is to be made. It’s an optional argument.

= TREND ( B2:B13, A2:A13, 1, true ) - TREND ( B2:B13, A2:A13, 0, true )The above formula syntax will calculate the slope. The syntax also uses the same methods as applied in the FORECAST and INTERCEPT methods to arrive at the slope of the sample data.
Conclusions
Google Sheets offers many ways you can calculate the slope from your sample data.
You can see the slope is more than a tool used for calculating the steepness of a line. It creates an avenue for further analysis and prediction of your data.
Using the slope, you can easily identify how your variables relate to each other, identify trends, and create models.
What other methods of finding slope do you know? Let me know in the comments section below!


0 Comments